Wide graph and waterfall
The wide graph is Linrad's main wideband display: an averaged power spectrum above a scrolling colour waterfall, both fed by the first FFT. It is where signals are found and where the operator sets the receive frequency and passband that drive the whole narrowband chain.
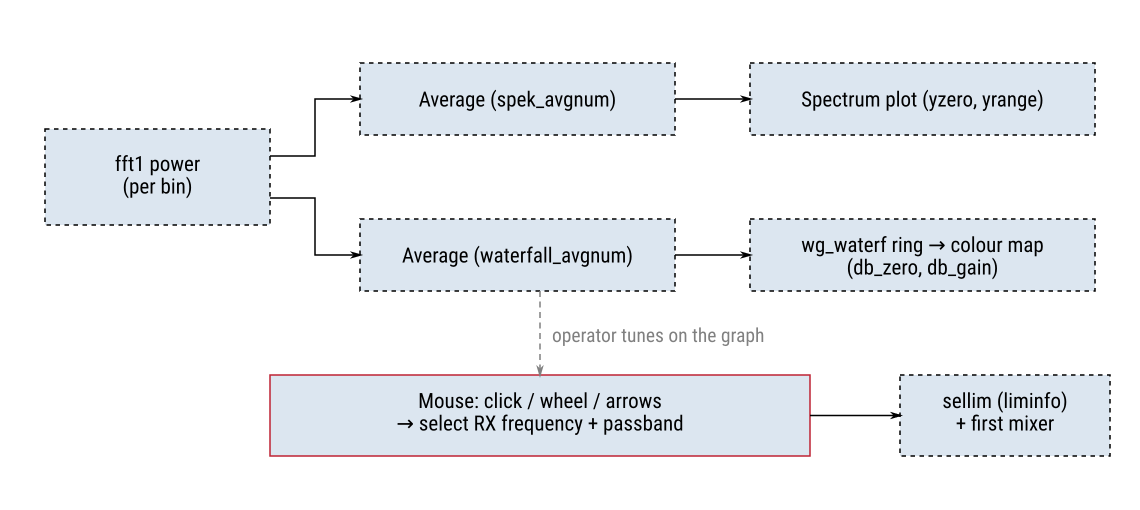
From fft1 to the display#
The first-FFT bin powers are averaged (over spek_avgnum transforms) and drawn as the spectrum on a dB scale (yzero, yrange). In parallel they are averaged over waterfall_avgnum, written to the wg_waterf ring buffer and colour-mapped using a zero and gain (waterfall_db_zero, waterfall_db_gain) to produce the scrolling waterfall. spur_inhibit suppresses the automatic spur search while looking at the raw spectrum.
In the source
Waterfall data is produced by fft1_waterfall() (in fft1.c, called from the FFT1 thread) into the wg_waterf ring; the display is drawn in wide_graph.c using the colour factor from make_wg_waterf_cfac() — wide_graph.c:424 (wg_waterf_cfac = waterfall_db_gain·0.01, wg_waterf_czer from waterfall_db_zero). Averaging counts and scale live in WG_PARMS wg — globdef.h:907 (fft_avg1num, spek_avgnum, waterfall_avgnum, yzero, yrange, waterfall_db_zero, waterfall_db_gain, spur_inhibit). Gain/zero changes: change_wg_waterfall_gain() / change_wg_waterfall_zero() — wide_graph.c:667.
Tuning: selecting frequency and passband#
A mouse click on the graph selects the receive frequency; the mouse wheel and arrow keys step it, and a passband cursor shows the current filter. The selected frequency sets mix1_selfreq, which selfreq_liminfo() uses to mark the passband in liminfo[] (see the channel split) and which the first mixer tunes to 0 Hz. A right-drag runs a signal-analysis / occurrence measurement over a selected region.
In the source
Frequency selection wide_graph_selfreq() — wide_graph.c:92; mouse handling mouse_on_wide_graph() — wide_graph.c:923 and mouse_continue_wide_graph_rightpressed() — wide_graph.c:234; frequency stepping move_rx_frequency() / step_rx_frequency() — wide_graph.c:179; passband cursor add_mix1_cursor() — wide_graph.c:127; new-signal creation make_new_signal() — wide_graph.c:162. The selected frequency flows to selfreq_liminfo() (sellim.c:38) and the first mixer.
Related#
The wide graph is fed by the first FFT and drives the first mixer / narrowband chain; the selected passband is shown in detail on the baseband graph. It is the front end of the whole signal chain. Its waterfall is one of several displays; the time-domain oscilloscopes are covered separately.